Battery degradation test
Test Description and Objectives
The objective of this test is to perform and analyse the degradation of the battery in LEO orbit thermal conditions.
Due to time constraints, in order to see the proper degradation of the battery, a full charge and discharge of the battery will be carried out. That is, charging to 4.2V and discharging till 2.7V at a rate of C/2 mA. As to the temperature conditions, the same logic has been followed. The charging cycle will be done at the highest possible working temperature (40ºC) and a moderate 10ºC for the discharge cycle (instead of the lowest 2ºC). This configuration has been adopted because the battery will normally be charged by the solar panels when the PocketCube is facing the sun and discharged during the eclipse phase.
Requirements Verification
| Requirement ID | Description |
|---|---|
| 1 | Battery can be charged |
| 2 | Battery can be discharged |
| 3 | Battery voltage shall be recorded during all the test duration |
| 4 | Battery current shall be recorded during all the test duration |
| 5 | Battery temperature shall be recorded during all the test duration |
| 6 | Total power charged to the battery shall be recorded |
| 7 | LEO thermal conditions must be simulated |
Test Set-Up
- Subsystem and its components.
- Battery tests apparatus.
- 2 power supply cables with bananas in both sides.
- 2 power supply cables with bananas in one side and exposed copper in the other one.
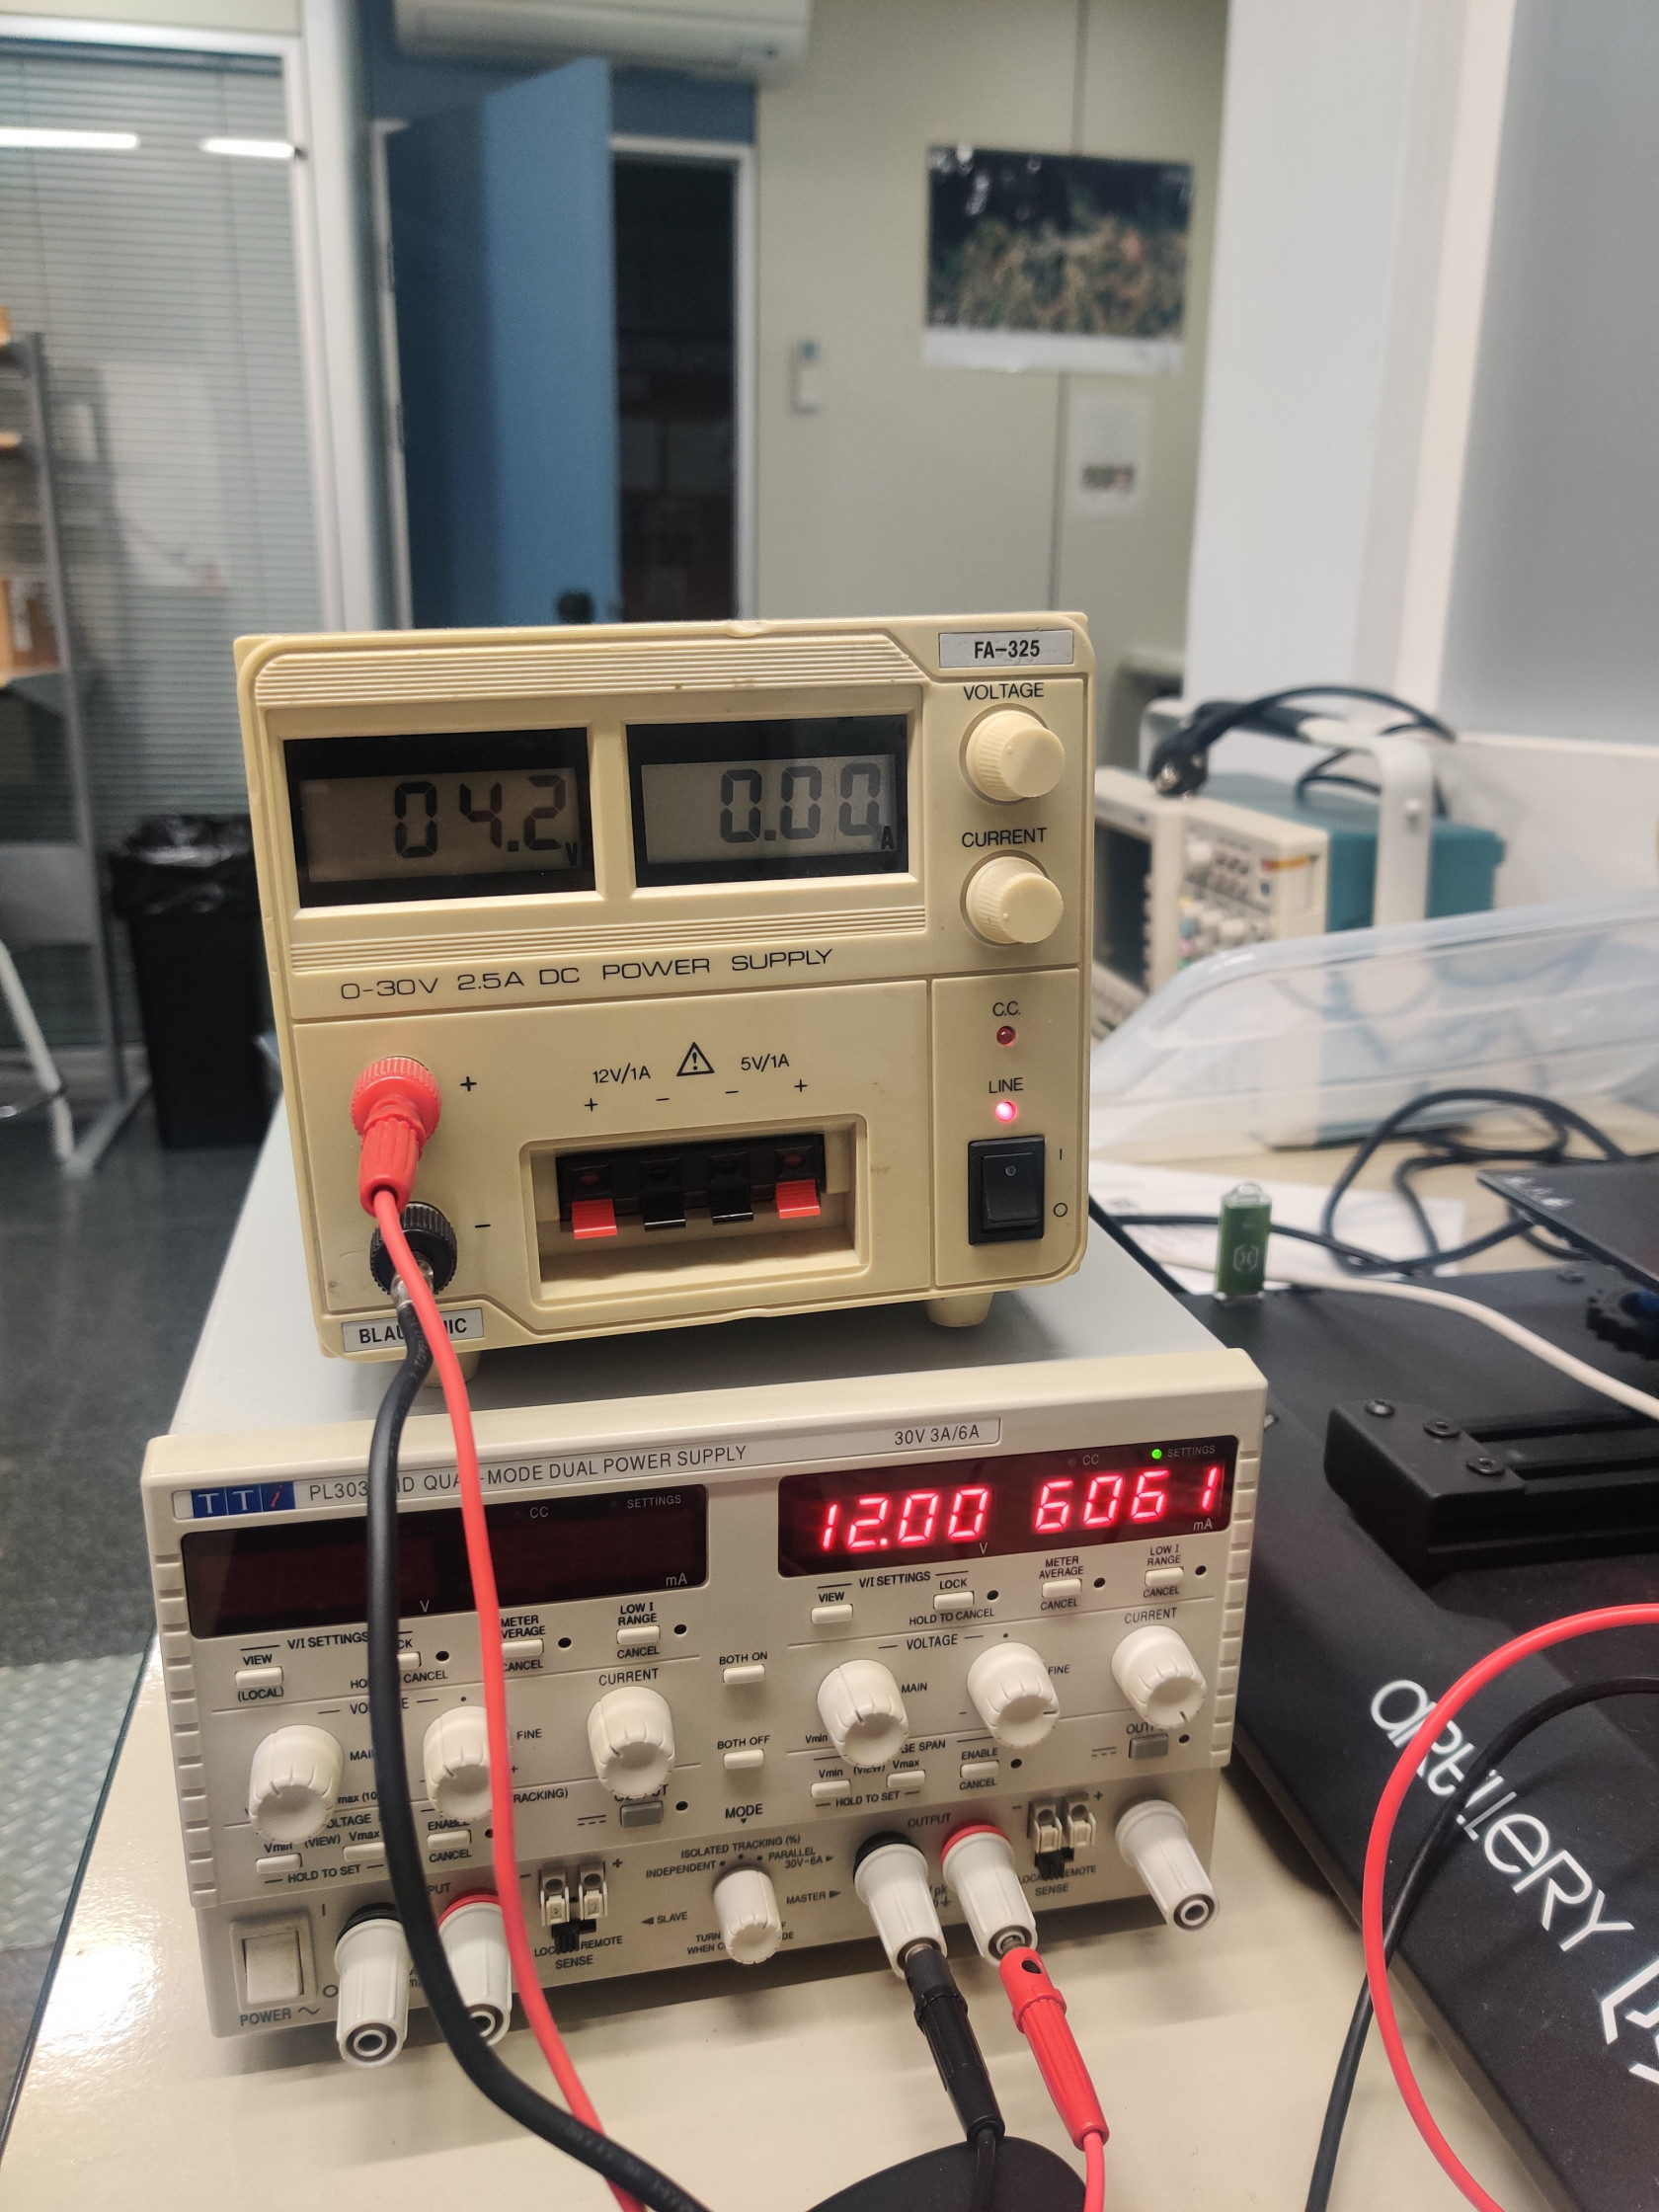
- Dual power supply or 2 independent ones. One must be able to supply 12V and 6A the other one must be able to supply 4,2V and 1A.
- Flat small screwdriver.
- USB A to USB B cable.
- Computer with the Arduino IDE and Putty Installed to log data.
- Battery to perform the test one.
- 2,5 A Fuse and fuse holder.
- Some wire.
- Connectors to connect cable between them.
- Empty metal case for the battery.
Pass/Fail Criteria
This test is designed to characterize a degradation of the PocketQube battery over a great number of cycles and temperature ranges. There is no pass or fail criteria as the result will be the information pertaining to the charge and discharge curves of the battery.
Test Plan
- Regulate the power supply with one channel set to 12V and 6 A and the other channel set to 4,2V and adjust the current limit so it matches the max desired charge current.
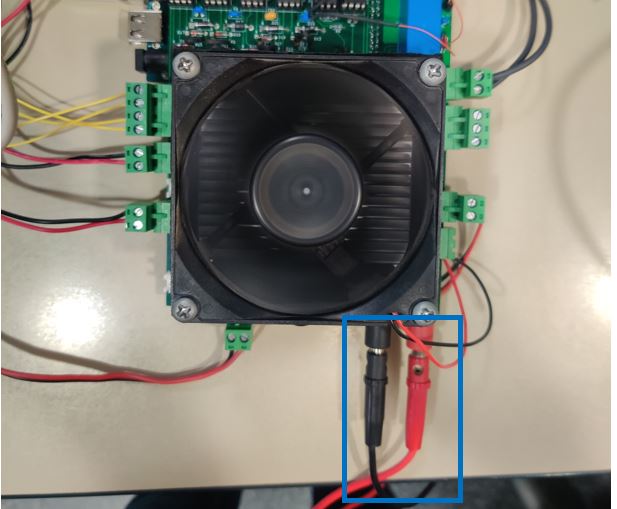
- Connect with 2 banana cables the 12V output from the power supply to the banana connectors from the battery test apparatus respecting the polarity. DO NOT ENABLE THE POWER SUPLY OUTPUT YET.
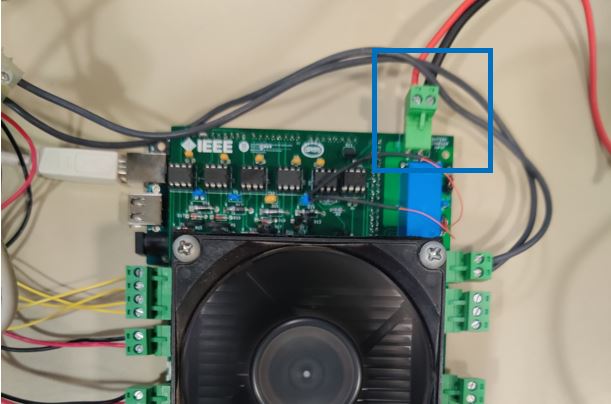
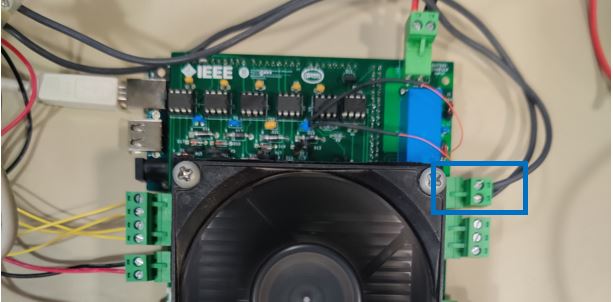
- Connect the output from the 4,2V power supply to the top terminal block labelled as BATTERY CHARGE INPUT respecting the polarity. DO NOT ENABLE THE POWER SUPLY OUTPUT YET.
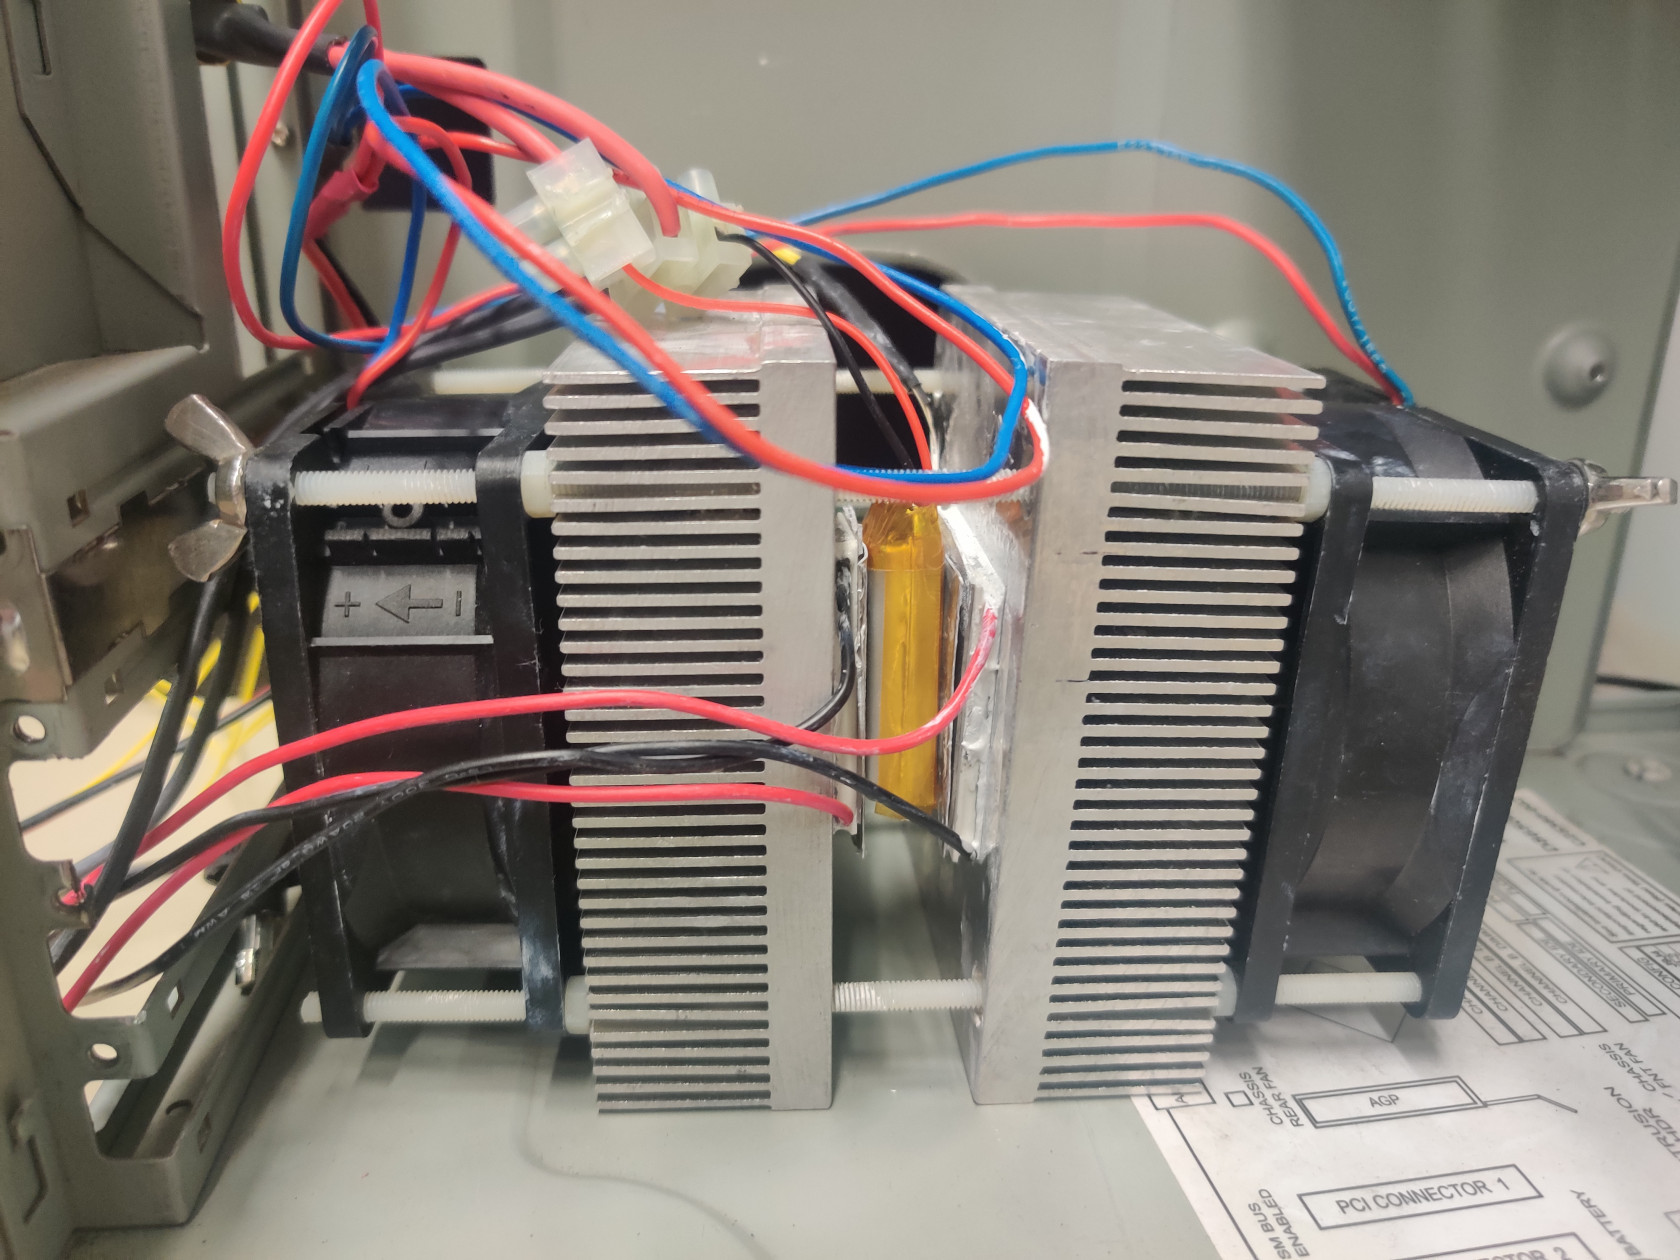
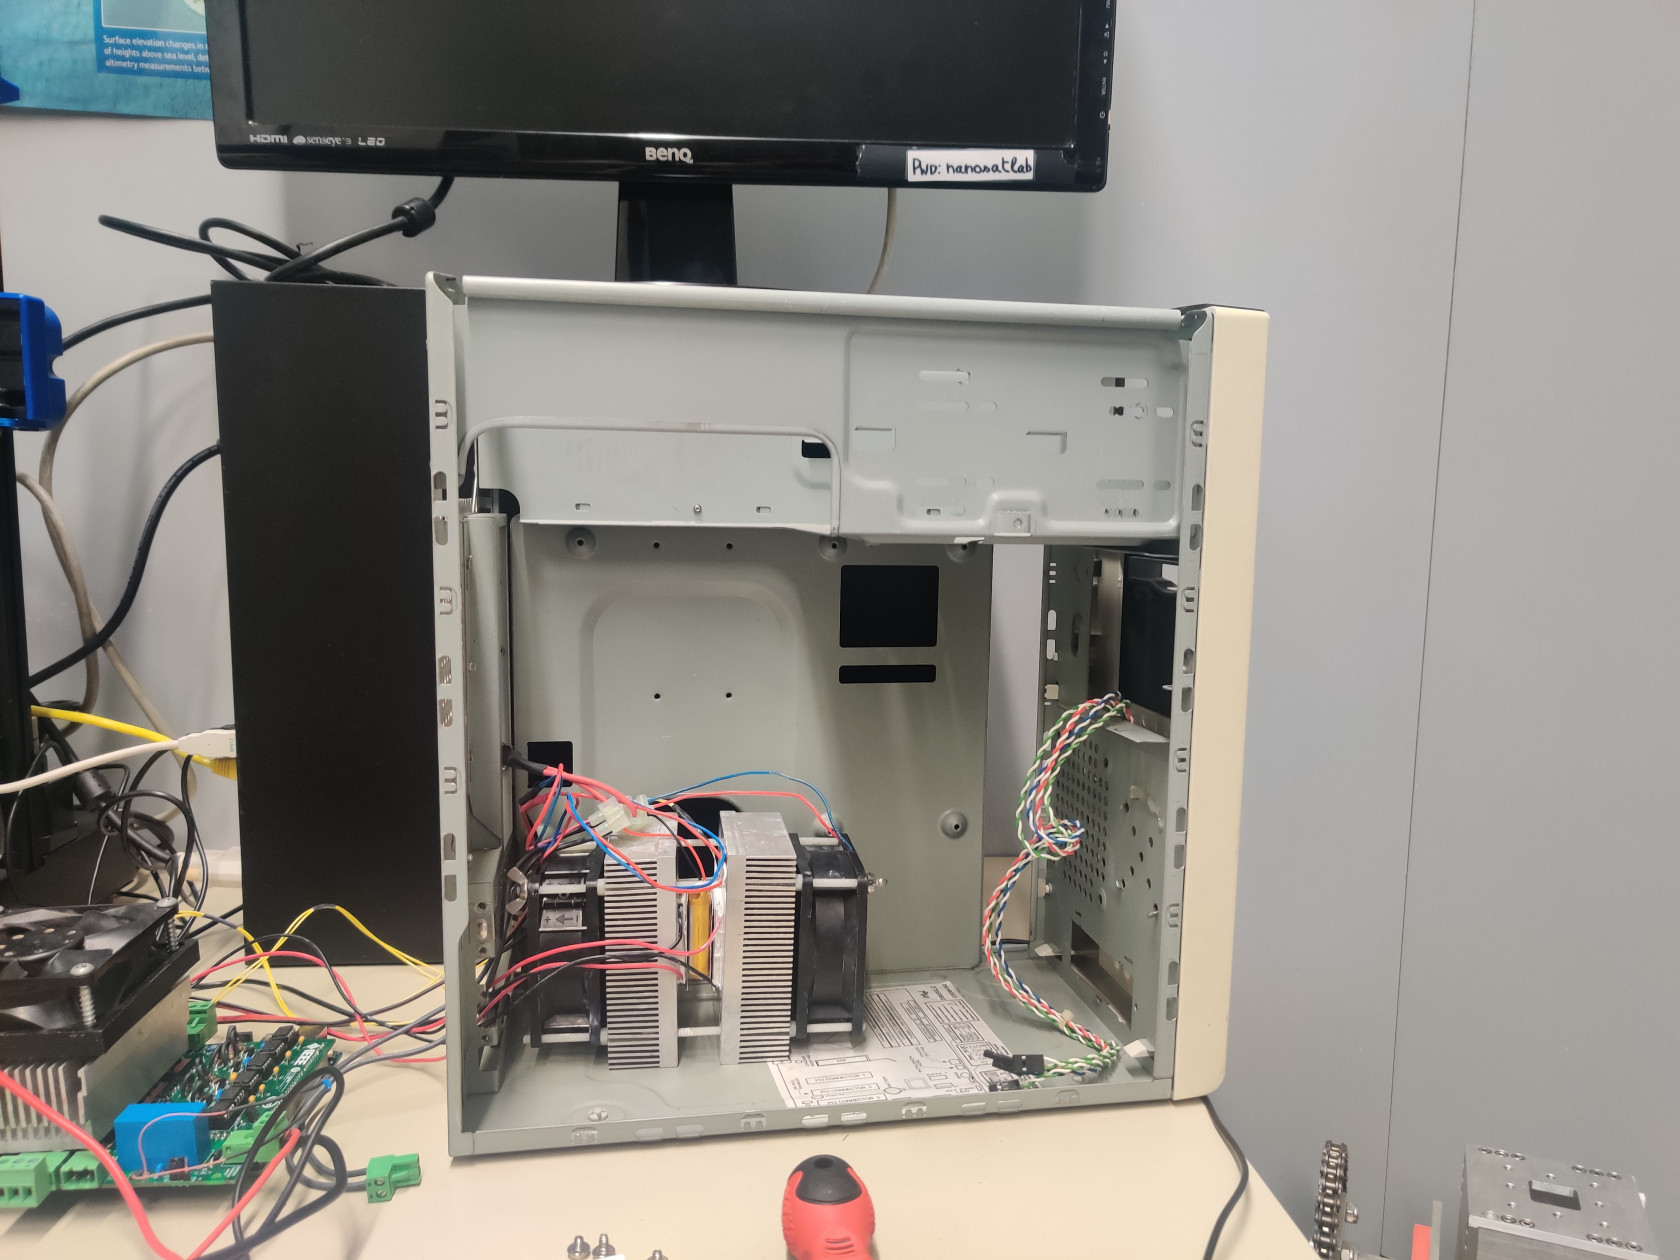
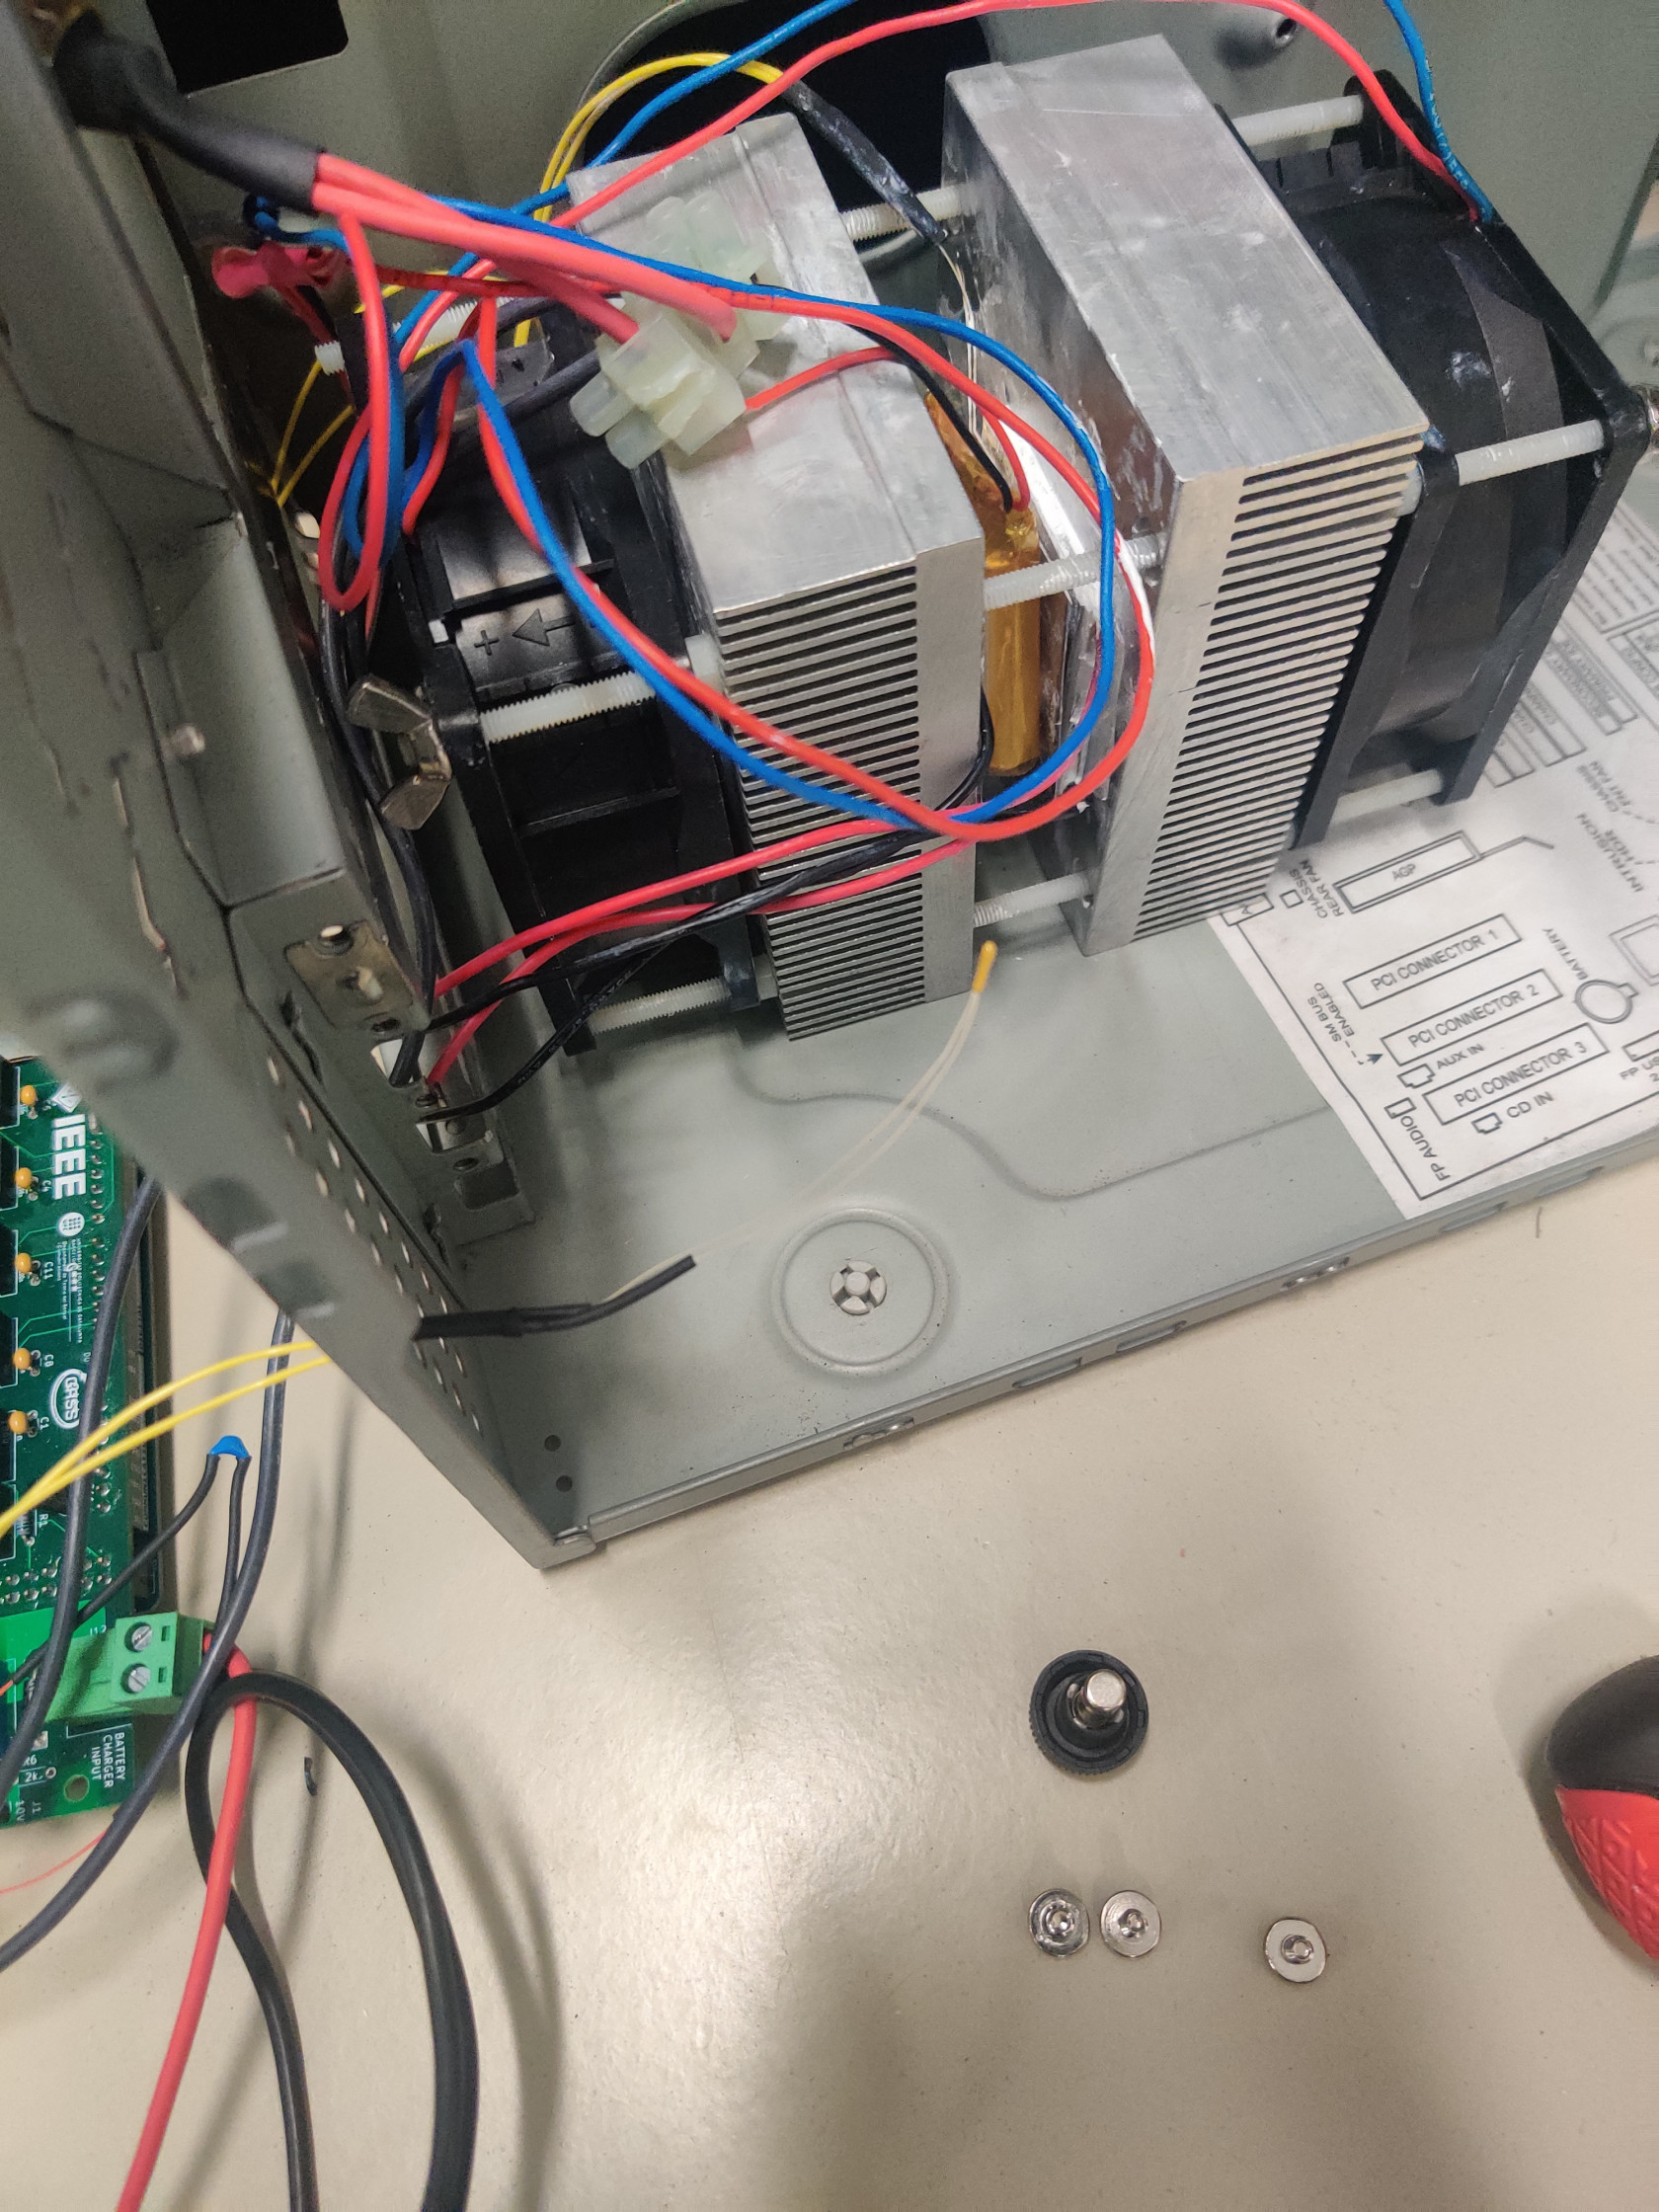
- Place the battery between the TEC module assembly halves.
- Place the assembly with the battery inside a metal box for protection and route the cables outside.
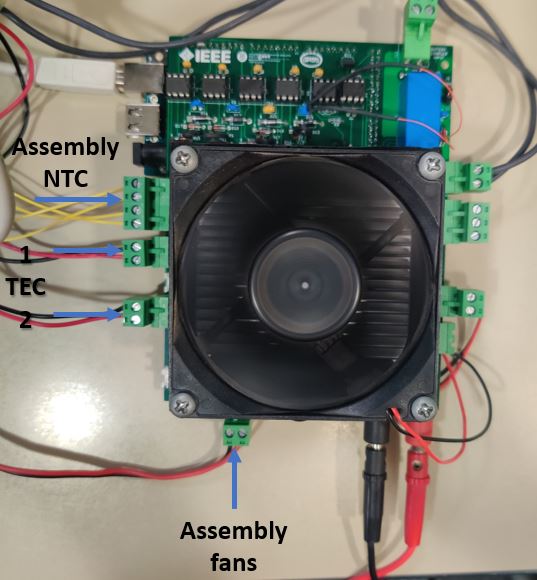
- Connect the NTC, FANS and TEC modules to the battery test apartus headers (check labels especially in the case of the TEC modules)
- Conect the remaining NTC to the port labelled as NTC Heatsink and put it inside the metal box to have an ambient temperature reference point.
-
Close the metal box
-
Enable the 12V power supply output.
-
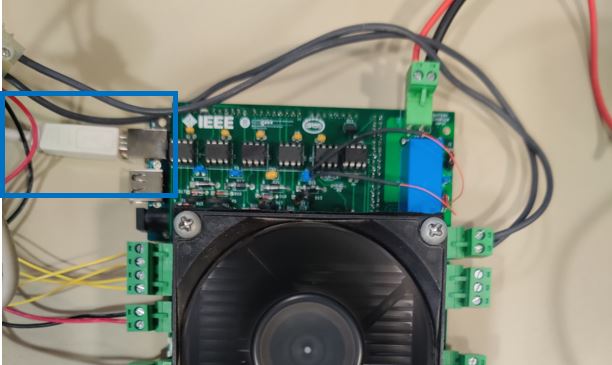
Connect the USB cable to the Arduino and PC and upload the charge .ino test code to the board. Select the adequate COM port on the Arduino IDE and remember it for the following steps.
-
Disconnect the USB cable from the PC.
-
Disable the 12V output.
-
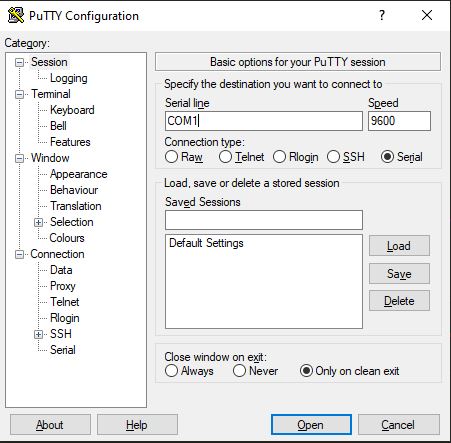
Open PUTTY and select connection type: Serial and write down the Arduino COM port previously indentified. If the OS is Linux, it will probably be /dev/ttyACMX where 'X' is the port number.
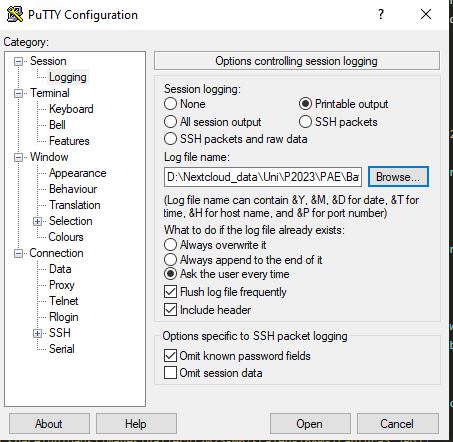
- In PUTTY go to the Logging tab and select Printable Output and select the folder where you want to save the test data.
- Connect the battery cables to the terminal block labelled as BATERY respecting polarity and installing a Fuse of 2,5A between the battery test apparatus and the battery.
-
Enable both power supply channels.
-
Connect the USB cable to the PC and click on Open on the PUTTY software.
-
If all steps were performed correctly, the text START ARDUINO will be visible, and, after pressing any key of the keyboard, the test will start. Every 5 seconds a new line will be written indicating the voltage, current, accumulated power and temperature separated by a semicolon (“;”)
-
Each cycle end will be indicated on screen and at the beginning of each charge cycle the test iteration will be written. At the end of the entire test, a “TEST END” prompt will appear. Note that for a test of 10 iterations will take approximately 3 days to complete.
-
Disconnect USB cable.
-
Turn off power supplies.
-
After that the data will be available in the folder you selected before, and you can use the software you prefer to graph and analyse the result data from the CSV file.
Test Results
This battery degradation test has lasted 844 hours and taking into account that a full charge and discharge cycle lasts approximately 4 hours, a total of 211 full cycles have been performed.
1. Voltage
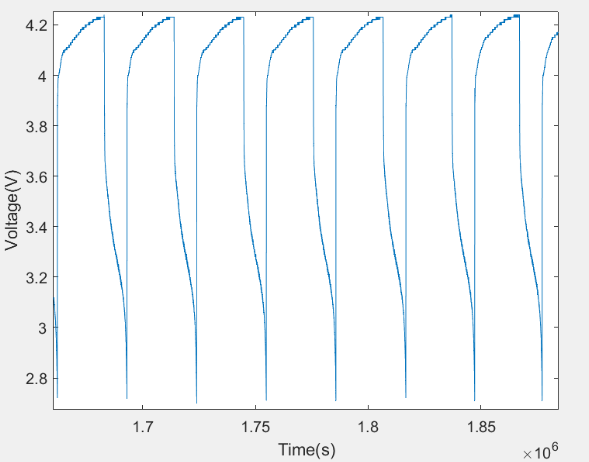
As it is seen, the votltage range is from 2.7 V to 4.3 V. It is faster for discharging than for charging because in charging mode when it is almost getting to the final charge voltage the cells are trying to get the equilibrium. For this reason, it is possible to see the slowest part from 4.1 V till 4.3 V.
2. Current
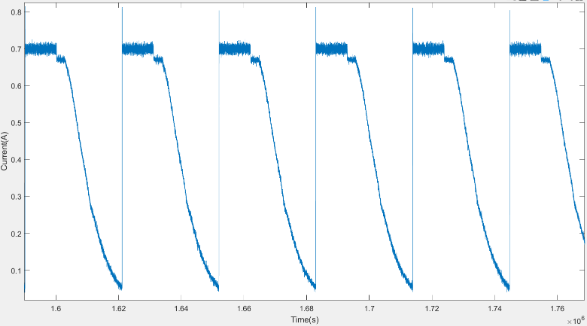
As the capacity of the battery is 1400 mAh, the current charge is 700 mA so as not to exceed the limit, for this reason we have a constant current and an almost linear discharge part as it discharges. The lowest current level is when it reaches to 2.7 V.
3. Energy
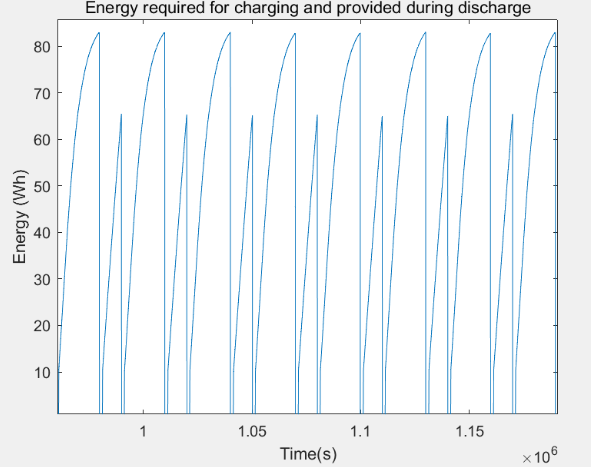
In the previous graph, the highest plots are the energy in the charge cycle and the lowest ones represents the battery discharged or provided by the battery. It is seen that the last pic compared with the first one of the lowests plots is slightly lower than the first one. Let's see the complete charge and discharge cycles of the test:
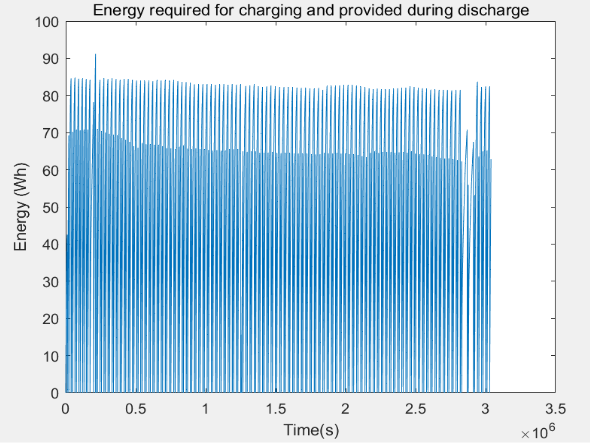
As the number of cycles increases, the battery capacity decreases. At the beggining of the test the battery provided around 70 Wh for one discharge cycle and at the end of the test it provided around 65 Wh for 1 discharge cycle.
4. Modules temperature
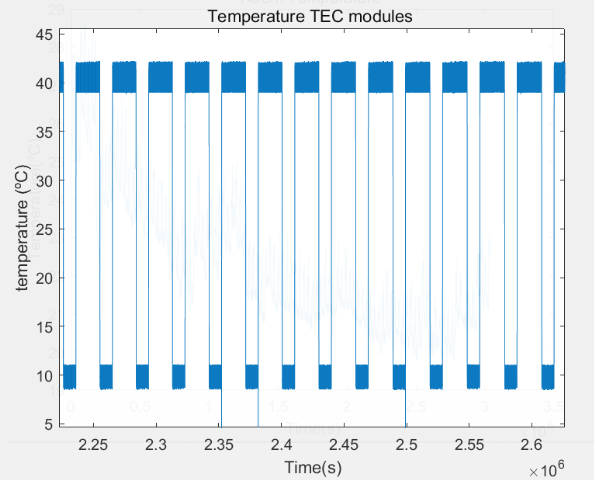
This plot represents the temperatures at the charge and discharge cycles. For charging the battery, the modules temperature is set to 40 ºC. For discharging, the temperature is set to 10 ºC.
Conclusions
It is seen in the energy plots the loss of effective energy provided by the battery. The battery starts providing 70 Wh for a discharge cycle and finally provides 65 Wh. This means that for every charge and discharge cycle is lost 23.7 mWh
On the other hand, as it can be seen in the beginning of the voltage curves, the battery was subjected to a voltage higher than the maximum due to overheating of the power sources, and there were no serious consequences for it.
Even though the test may not be entirely conclusive because of its time constraints, it does show the robustness of the battery. The PocketCube energy requirements are much smaller than the ones subjected in this test and therefore it can be concluded that the battery is suited for the mission.
The code is available at: https://github.com/nanosatlab/pocat-sw/tree/main/Battery%20test%20aparatus/Arduino%20Code/Degradation_testing

No Comments