Battery characterization test
Test Description and Objectives
The objective of this test is to perform and analyse a charge cycle of the battery using the battery test equipment.
Requirements Verification
| Requirement | Description |
|---|---|
| 1 | Battery can be completely charged |
| 2 | Battery can be completely discharged |
| 3 | Battery voltage shall be recorded during all the test duration |
| 4 | Battery current shall be recorded during all the test duration |
| 5 | Battery temperature shall be recorded during all the test duration |
| 6 | Total power charged to the battery shall be recorded |
Test Set-Up
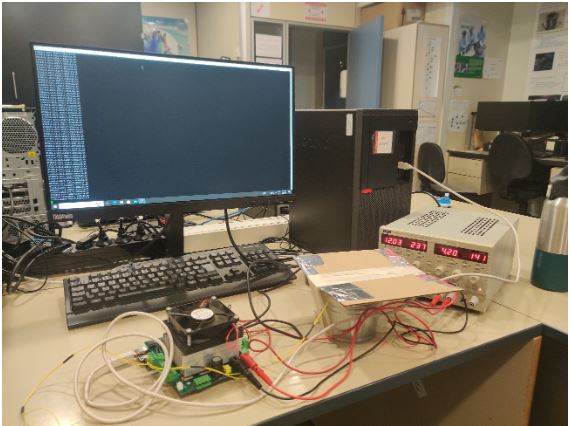
The test setup can be seen below
- Subsystem and its components
- Battery tests equipment.
- 2 power supply cables with bananas in both sides.
- 2 power supply cables with bananas in one side and exposed copper in the other one.
- Dual power supply or 2 independent ones.
- Flat small screwdriver.
- USB A to USB B cable.
- Computer with the Arduino IDE and Putty Installed for data logging.
- Battery to be tested.
- 2,5 A Fuse and fuse holder.
- Some wire.
- Connectors to connect cable between them.
- Metal container for the battery.
Pass/Fail Criteria
This test is designed to characterize a charge cycle for the PocketQube battery. There is no pass or fail criteria as the result will be the charge curves of the battery. However, after having these curves, depending on the application, further study can be needed, in order to determine whether the battery is suitable for the desired task.
Test Plan
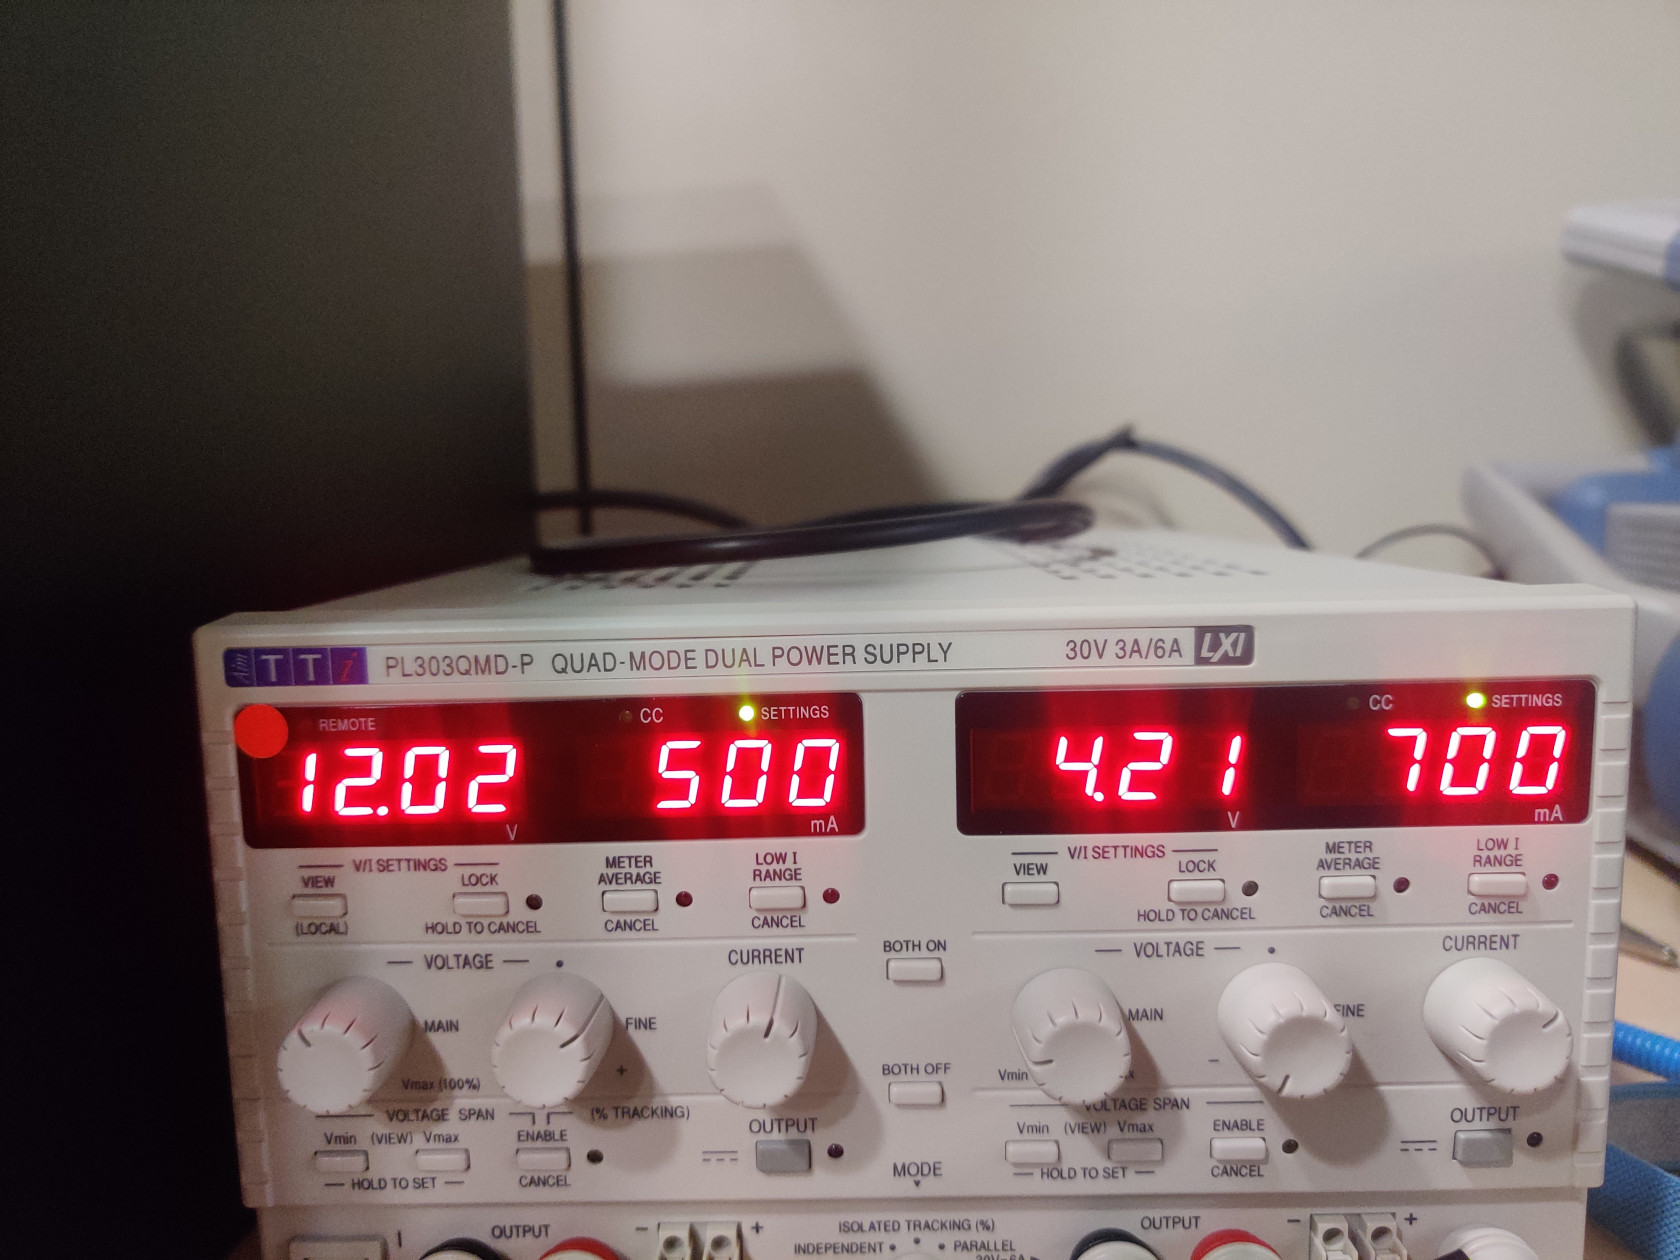
- Regulate the power supply with one channel set to 12 V and 500 mA and the other channel set to 4,2 V and C/2 mA (current limit should be equal to half the battery capacity) 700 mA for this battery test.
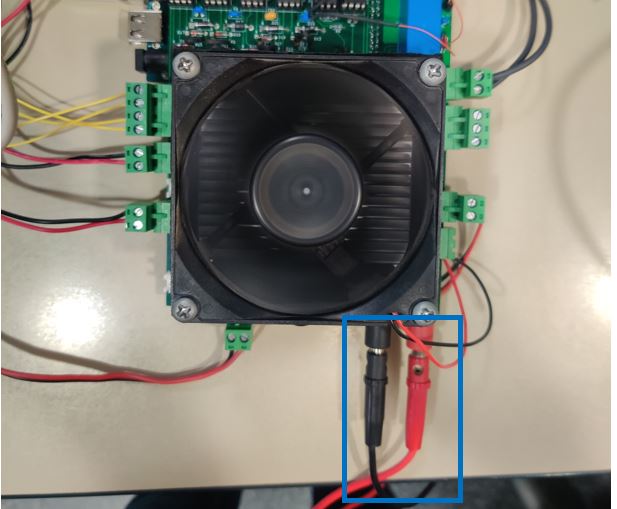
- Connect using 2 banana cables the 12V output from the power supply to the banana connectors from the battery test apparatus respecting the polarity. DO NOT ENABLE THE POWER SUPLY OUTPUT YET.
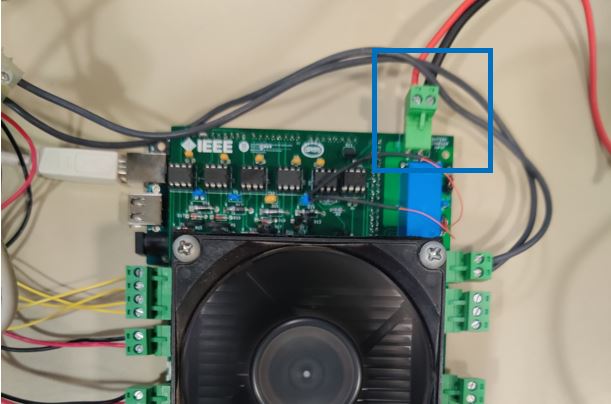
- Connect the output from the 4,2V power supply to the top terminal block labelled as BATTERY CHARGE INPUT respecting the polarity. DO NOT ENABLE THE POWER SUPLY OUTPUT YET.
-
Attach the NTC to the battery under test using tape. Wrap it as tight as possible to ensure good contact between the NTC and the battery. The NTC that needs to be attached to the battery is the TOP one from NTC Battery 4 pin block terminal marked with a yellow dot on the block terminal.
-
Enable the 12V power supply output.
-
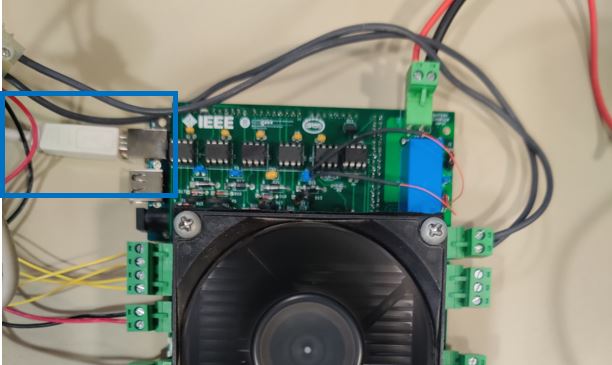
Connect the USB cable to the Arduino and PC and upload the charge .ino test code to the board. Select the adequate COM port on the Arduino IDE and remember it for the following steps.
-
Disconnect the USB cable from the PC.
-
Disable the 12V output.
-
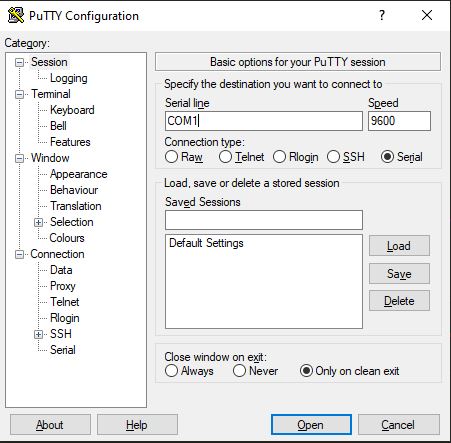
Open PUTTY and select connection type: Serial and write down the Arduino COM port previously indentified.
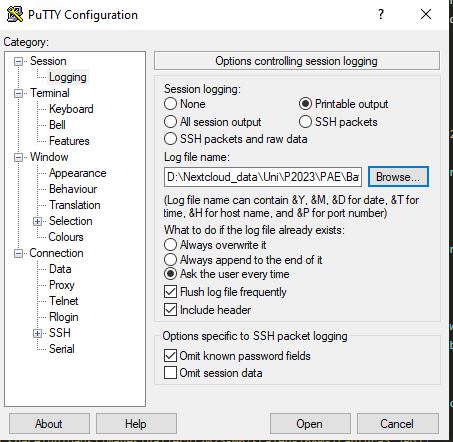
- In PUTTY go to the Logging tab and select Printable Output and select the folder where you want to save the test data.
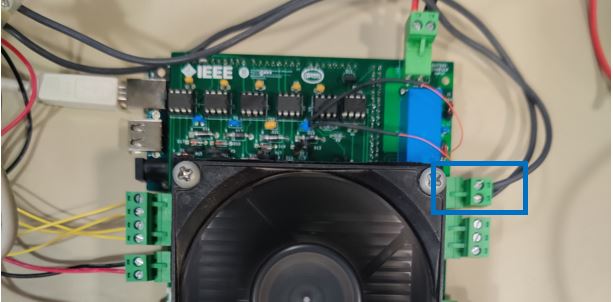
- Connect the battery cables to the terminal block labelled as BATERY respecting polarity and installing a Fuse of 2,5A between the battery test apparatus and the battery.
-
Put the battery inside the metal container as a precaution measure in case of explosion.
-
Enable both power supply channels.
-
Connect the USB cable to the PC and click on Open on the PUTTY software.
-
If all steps were performed correctly, the text START ARDUINO will be visible, and, after pressing any key of the keyboard, the test will start. Every 5 seconds a new line will be written indicating the voltage, current, accumulated power and temperature separated by a semicolon (“;”).
-
Each cycle end will be indicated on screen and at the beginning of each charge cycle the test iteration will be written. At the end of the entire test, a “TEST END” prompt will appear. Note that for a test of 10 iterations will take approximately 3 days to complete.
-
Disconnect USB cable.
-
Turn off power supplies.
-
After that the data will be available in the folder you selected before, and you can use any software capable to graph and analyse the result data from the CSV file.
Test Results
This test was carried out at NanosatLab between 02/06/2023 and 05/06/2023 by Adrià Molló Carulla. The RAW data in CSV and also the processed data in an Excel file is attached to this document. This has been performed at ambient temperature (cca 25C). While already a good breakthrough, if time allows, a hot (40C) and cold (4C) case should also be performed for at least 5 cycles.
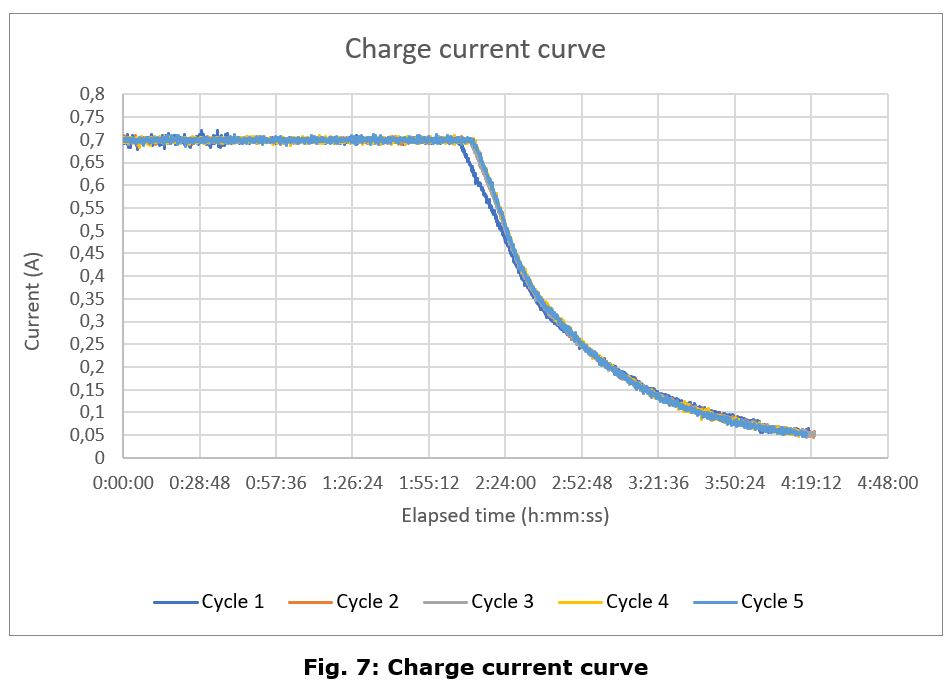
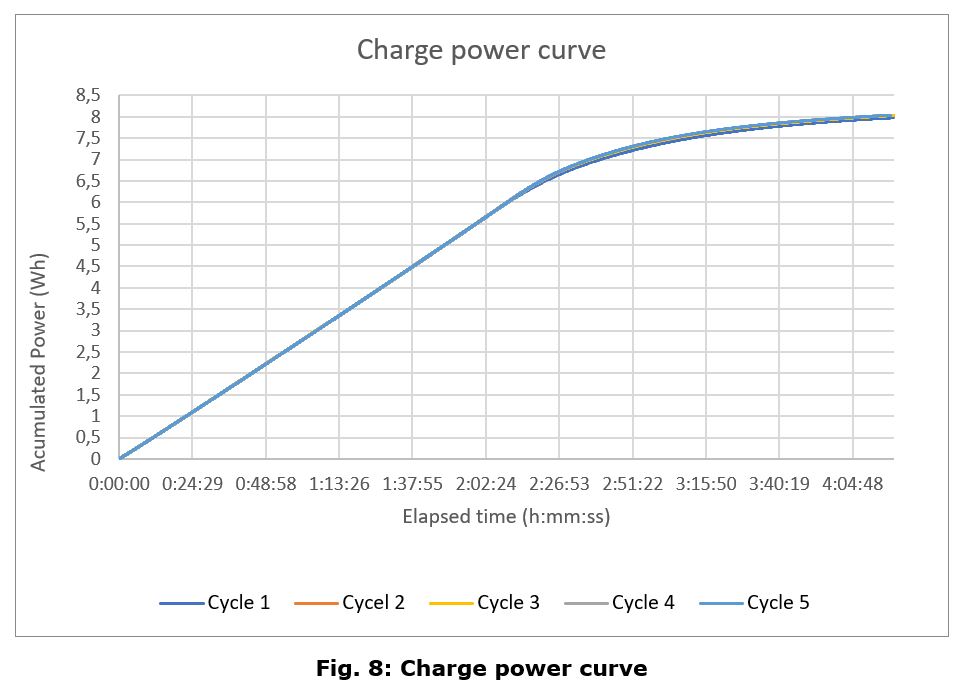
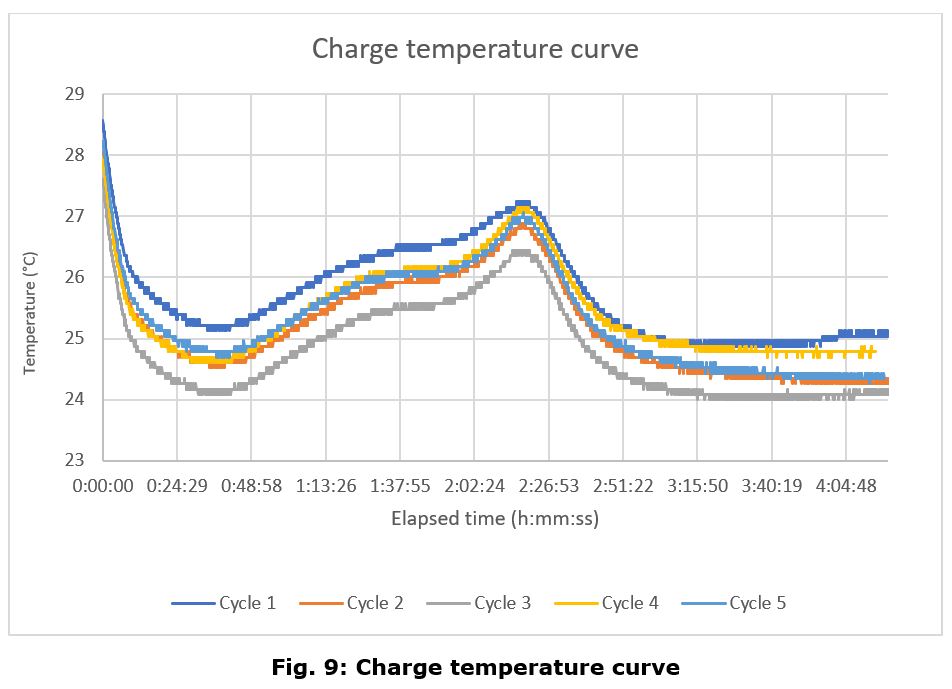
Frome the test the following results have been obtained:
Discharge Cycle
Charge Cycle
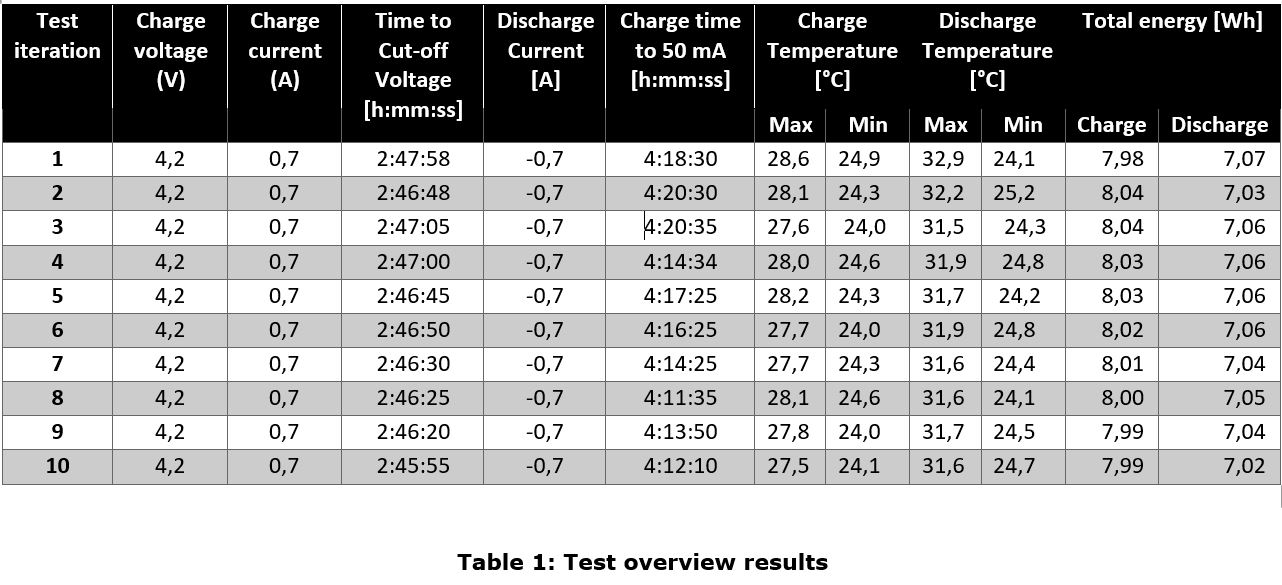
In Table 1 there is an overview of the main parameters of the battery for each iteration
Anomalies
It has been found that the battery capacity appears to be considerably higher than the declared by the manufacturer (5,16 Wh) compared to the tested one (7,07 Wh).
Conclusions
The main conclusions of this test campaign are that the battery charge and discharge curves look follow the same pattern as a generic lithium polymer battery, with no appreciable differences, except for the aforementioned anomaly.
The full test code is available at:
Link broken, to be inserted.



No Comments